
Using CASE statements to create new groupings of your data as custom dimensions in Google Looker Studio is an incredibly useful tool for customizing your reports and analyzing your data in ways that aren’t otherwise possible.
Custom groupings created by CASE statements add new ways for you to slice and dice your data. With CASE statements, you can segment data in a million different ways, but in this post we outline a few basic uses to get you started:
- Non-branded traffic vs. branded
- Events by category, action or label
- Blog traffic vs. all other traffic
- Paid vs. earned traffic
- Campaign A, B, C vs. Campaigns D, E, F
The use cases for CASE statements are only limited to your creativity and imagination.
What is a CASE Statement, and how do you write one?
Said most basically, a CASE statement is a bit of code which looks for items that match a given set of parameters, and assigns a value to that item as a result.
In Google Looker Studio, we can create a new dimension and then assign values in our new dimension to any number of items in our dataset based on the conditions we set in our CASE statement.
How to write a CASE statement
Here is an example CASE statement we might use in Google Looker Studio:
case
WHEN Campaign='Campaign A' THEN "Group 1"
WHEN Campaign='Campaign B' THEN "Group 1"
WHEN Campaign='Campaign C' THEN "Group 2"
ELSE "Other Campaigns"
end
Here is a breakdown of each line of that CASE statement:
case- Each CASE statement begins with “case” which is followed by a “WHEN” line
WHEN Campaign='Campaign A' THEN "Group 1"- This “WHEN” line references a dimension in our dataset, in this case “Campaign.”
- The condition we are setting with this line is that “Campaign” must equal “Campaign A.”
- When this condition is met, the value in this dimension is set whatever is after “THEN,” in this instance that’s “Group 1.”
WHEN Campaign='Campaign B' THEN "Group 1"
WHEN Campaign='Campaign C' THEN "Group 2"- Additional “WHEN” lines specify other conditions for our data, and what we want the values to be set as in these instances.
- In this example, if Campaign is equal to “Campaign B,” this data will join “Campaign A” data in having “Group 1” as its value for our new dimension.
- “Campaign C” is having a new group, “Group 2,” assigned as its value.
ELSE "Other Campaigns"- While not required in your CASE statements, you can include an “ELSE” line at the end which will assign a value to all items that didn’t match any of your WHEN line conditions. This is a good catch-all to make sure all of your data is given a value for your new dimension.
end- This marks the end of your CASE statement.
Register to get updates from our blog sent to your inbox!
How to add custom dimensions to your data sources with CASE statements
Knowing how to write a CASE statement is the first step, but to get the most out of this knowledge you’ll want to know where to utilize them in your Google Looker Studio reports.
Add a custom dimension
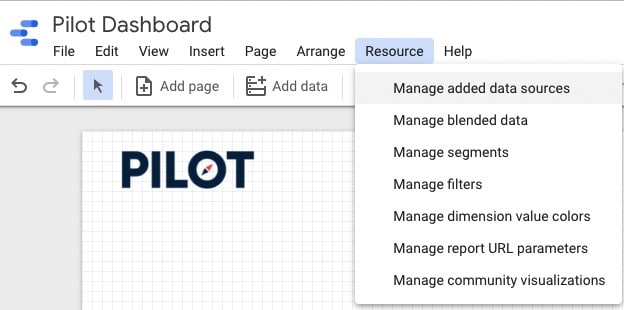
Click “Manage added data sources” under Resource
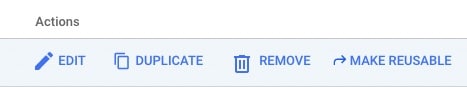
Click “edit” on the data source which you’re pulling data from.
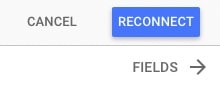
You may have to select “FIELDS” if you’re editing a Google Analytics data source with multiple views.
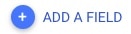
Click “ADD A FIELD”
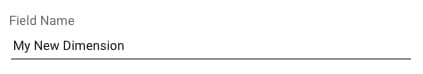
Name your field. This will be the name of your custom dimension—it will show in the dimensions list and be selectable in your Google Looker Studio report.
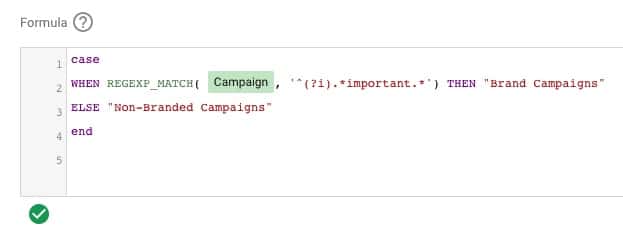
Write a CASE statement that defines the values of your custom dimension.
Hit SAVE at the bottom right.
Use your custom dimensions in your reports
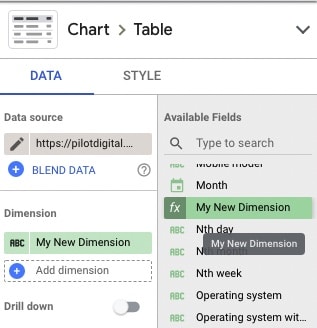
Once you’ve created a new dimension with a CASE statement, you can add it to your report. They can be added just like any other dimension, to a table, chart, scorecard or control.
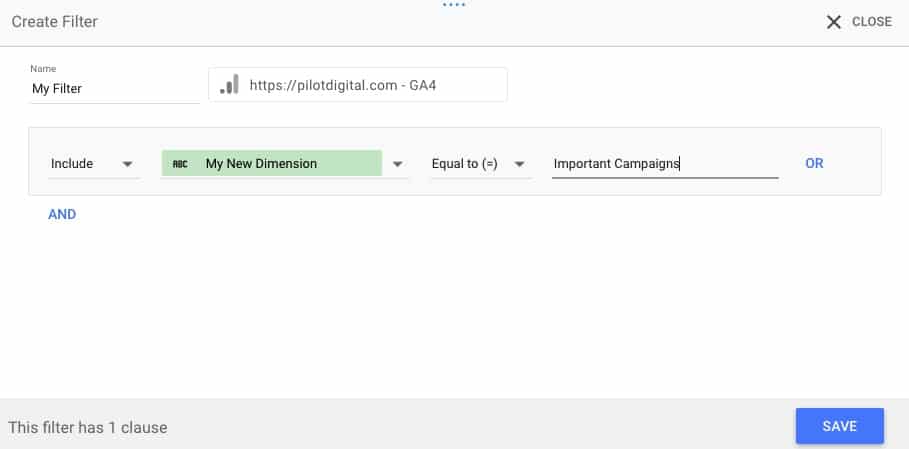
You can also use them in your report filters.
A few of the custom dimensions and CASE statements we’ve used to enhance our Looker Studio reports
Analyzing branded vs. non-branded queries from Google Search Console
You can use a CASE statement and a custom dimension that designates whether queries in your Google Search Console data are branded or non-branded. The example below assigns any queries containing “brandterm1,” “brandterm2,” or “brandterm3” as “Branded,” and the rest of the queries as “Non-Branded.”
Note: this CASE statement uses a Regular Expression (or RegEx) to define its conditions. More on RegEx at the end of this post.
The CASE Statement
case
WHEN REGEXP_MATCH(Query, '^(?i).*brandterm1.*') THEN "Branded"
WHEN REGEXP_MATCH(Query, '^(?i).*brandterm2.*') THEN "Branded"
WHEN REGEXP_MATCH(Query, '^(?i).*brandterm3.*') THEN "Branded"
ELSE "Non-Branded"
end
Adding a Control filter to your report
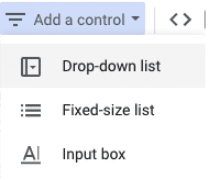
Once we’ve created this custom dimension, we often like to add it to a drop-down list control filter. To do this, go to Add a Control and select Drop-down list.
This will give any viewers of your report the ability to filter the data on-the-fly to view branded queries, non-branded queries, or all queries.
Comparing your event data by category, action or label
Note: this next one is a dated example of Universal Analytics data (sunset in July 2023). GA4 does not use event category, action and label, but hopefully this example can still be of use!
Typically, you cannot compare event data across different Event Categories, Labels and Actions in a Looker Studio report. But with a CASE statement and custom dimension, you are able to regroup your events in a manner that allows for this type of comparison.
The CASE Statement
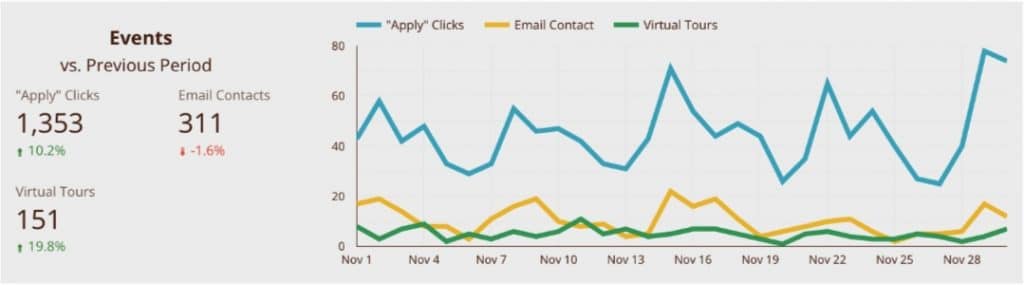
The following example involves a Google Analytics set-up with different Event Categories that we’d like to be able to display and compare in a time series chart. The CASE statement takes all events, and applies our new custom dimension to each, with the value set to identifiable terms:
case
WHEN Event Category='Apply' THEN '"Apply" Clicks'
WHEN Event Category='Email' THEN 'Email Contact'
WHEN Event Category='Tour' THEN 'Virtual Tours'
ELSE 'Other'
end
The Time Series Chart
When our new dimension is added to a time series chart (in this case, with “Other” filtered out), we’re able to compare these events against each other in the same chart:
Segmenting incoming blog traffic vs. other traffic
For many sites, it can be insightful to look at the differences between traffic that arrives via a blog post versus traffic that arrives on a regular page. If your blog posts are nested under a subdirectory, you can use a very simple CASE statement to create these two segments.
The example below would work for a site that has its blog posts nested under /blog/.
The CASE Statement
case
WHEN REGEXP_MATCH(Landing Page, '^/blog/.*') THEN "Blog traffic"
ELSE "Non-Blog Traffic"
end
Analyzing paid vs. earned traffic
Another way to look at your site’s traffic is by comparing traffic that is paid for with search ads or display ads, and traffic that is otherwise “earned,” which is essentially all traffic that wasn’t paid for.
This CASE statement combines the “Paid Traffic” and “Display” Default Channel Groupings in Google Analytics into one segment in our new dimension. The rest of the traffic is labeled as “Earned Traffic.”
The CASE Statement
case
WHEN REGEXP_MATCH(Default Channel Grouping, "Paid Search|Display") THEN "Paid Traffic"
ELSE "Earned Traffic"
end
Grouping similar campaigns together for high-level analysis
It can be a valuable tool to compare your campaigns in groups. The grouping is up to you — whether you group your campaigns by budget, location, ad type, or something else — but analyzing your campaigns in this way can provide insights to help you further optimize your PPC account.
The CASE statement is very similar to the Paid vs. Earned CASE statement in that it effectively gives you a higher level grouping than the dimension you’re referencing, except this CASE statement references “Campaign” instead of “Default Channel Grouping.”
The CASE Statement
case
WHEN Campaign='Campaign A' THEN "Group 1"
WHEN Campaign='Campaign B' THEN "Group 1"
WHEN Campaign='Campaign C' THEN "Group 1"
WHEN Campaign='Campaign D' THEN "Group 2"
WHEN Campaign='Campaign E' THEN "Group 2"
WHEN Campaign='Campaign F' THEN "Group 3"
ELSE "Other Campaigns"
end
Things to be aware of
Types of operators you can use in your WHEN conditions
In the examples above, we use both equals (=) and matching regular expressions (REGEXP_MATCH). But you can use other operators to set the conditions of your CASE statement. Some of the other operators we’ve used include:
- Less than (<) or greater than (>)
- REGEXP_CONTAINS, which returns true if the specified regular expression is contained in the field or expression, versus REGEXP_MATCT which returns true simply if X matches Y.
Using REGEX in your CASE statements
Regular expressions are a special set of characters that allow you to create patterns which, when evaluated against a string of characters, returns either true or false. Their main power lies in their ability to set both precise yet broad matching conditions.
We won’t get into the weeds of RegEx in this post, as it will never end! But there are plenty of resources and tools out there to help you write regular expressions that will work for your reports.
Note: Google uses RE2 syntax, so be aware of that fact when writing regular expressions for Looker Studio.
The ordering of your CASE statements
In a CASE statement, each WHEN conditional line is evaluated in order of its appearance and there are no overrides. Meaning, if something meets the conditions of the first WHEN line, it will ignore any additional WHEN lines even if it may also meet a later line’s conditions. The higher the WHEN line is in your CASE statement, the higher its priority is for setting values.
The power (and limitations) of custom dimensions in Google Looker Studio
There is one caveat to adding custom dimensions inside of Looker Studio: the more that you add, the slower your report becomes. Each custom dimension adds a calculation that your report has to perform on-the-fly, and these calculations can add up to eventually make your report a beast to use.
However, once you’ve started using CASE statements to create custom dimensions in your Google Looker Studio reports, you’ll quickly realize how useful they really are. Without having to make any changes to your data source (Google Analytics, Facebook, BigQuery, etc.) you can enhance your data, opening the door to so many new types of analysis. You just have to be selective about which custom dimensions are most useful to you, so that your Looker Studio Report can stay snappy and responsive.