Get all the digital marketing data that matters in one easy-to-use report
Gone are the days of scouring multiple reporting interfaces and tools to find out how your website and marketing efforts are performing. With Google Looker Studio, we create reporting dashboards that combine all the data that matters most to our clients from a range of sources—like Google Analytics, Google Ads, and social media platforms—into one singular report.
Pilot’s work migrating our web analytics to GA4 & building a Looker Studio dashboard has allowed our company to view website, SMM & SEM data in an accessible way. We can better track the ROI of paid advertising campaigns and monitor the overall health of our website. Plus, the automation of reporting saves our company time and energy.
Director of Marketing at Children’s Soccer Camp Franchise, Chicago, IL
One KPI report to rule them all
We know how it goes. It’s the end of the quarter and you need to report on your website’s performance, so you log into Google Analytics 4 (assuming your GA4 is set up and configured properly), open a tab for Google Ads, export a few tables from your CRM… your head is spinning before you’ve even had a chance to log into Facebook Business Manager. Wouldn’t it be nice to get all the KPI data and analytics from your host of marketing platforms in one place?
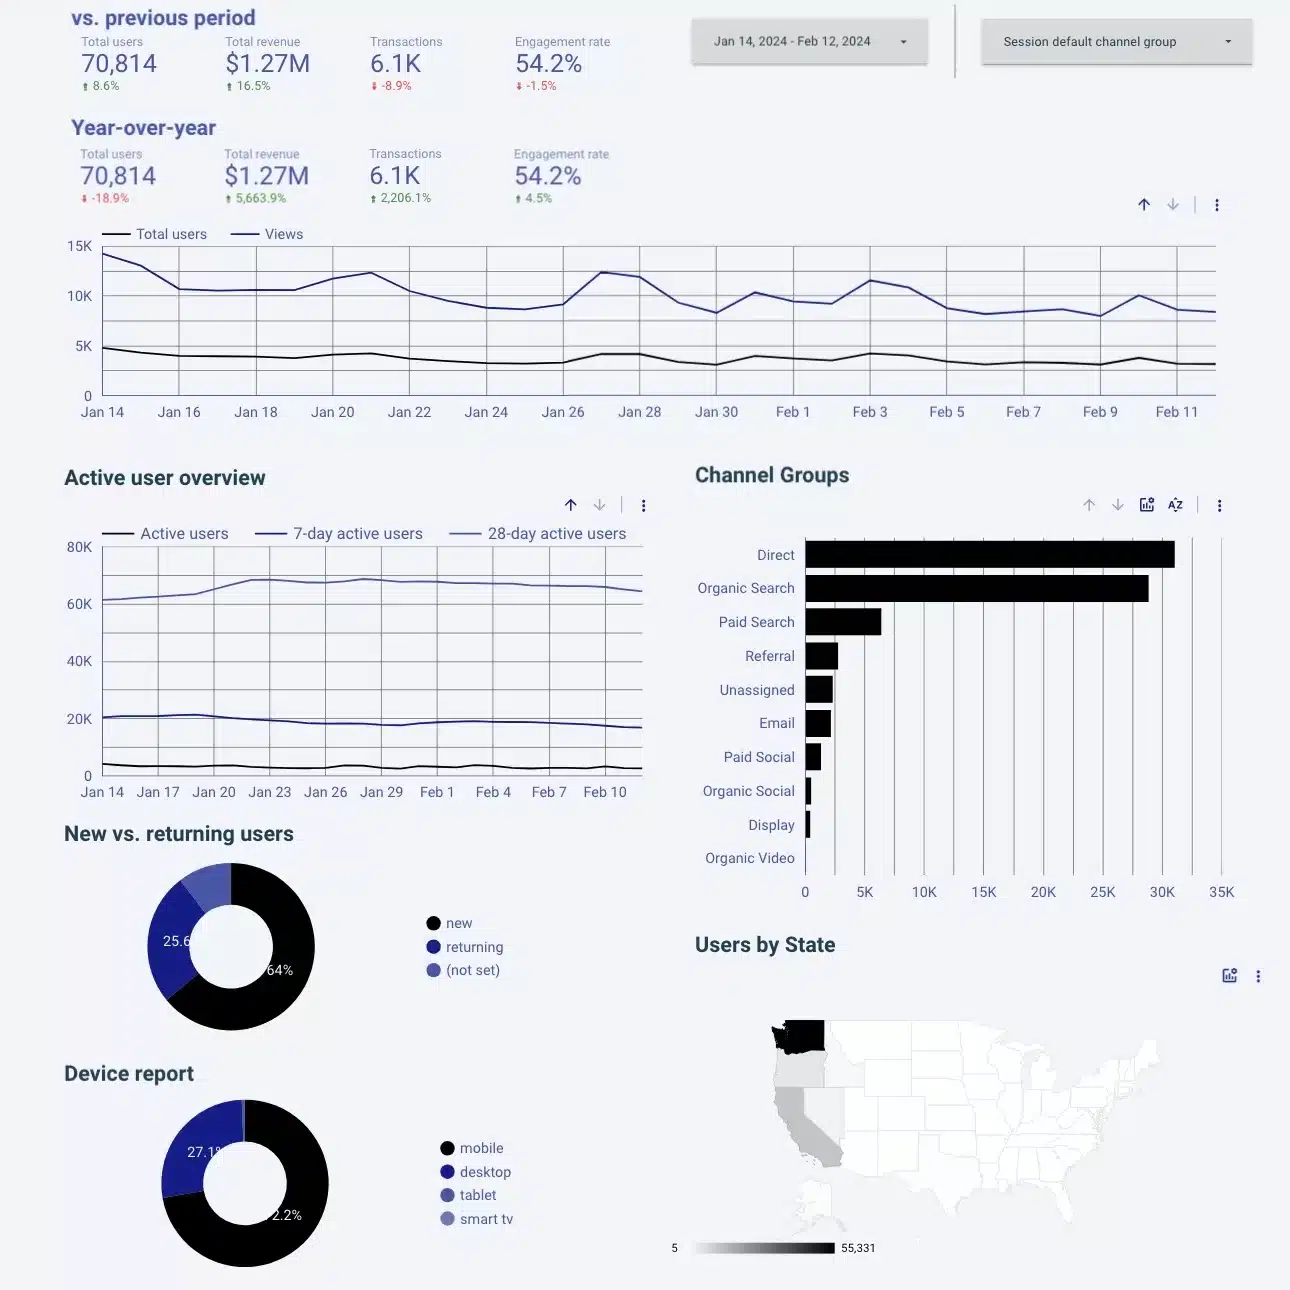
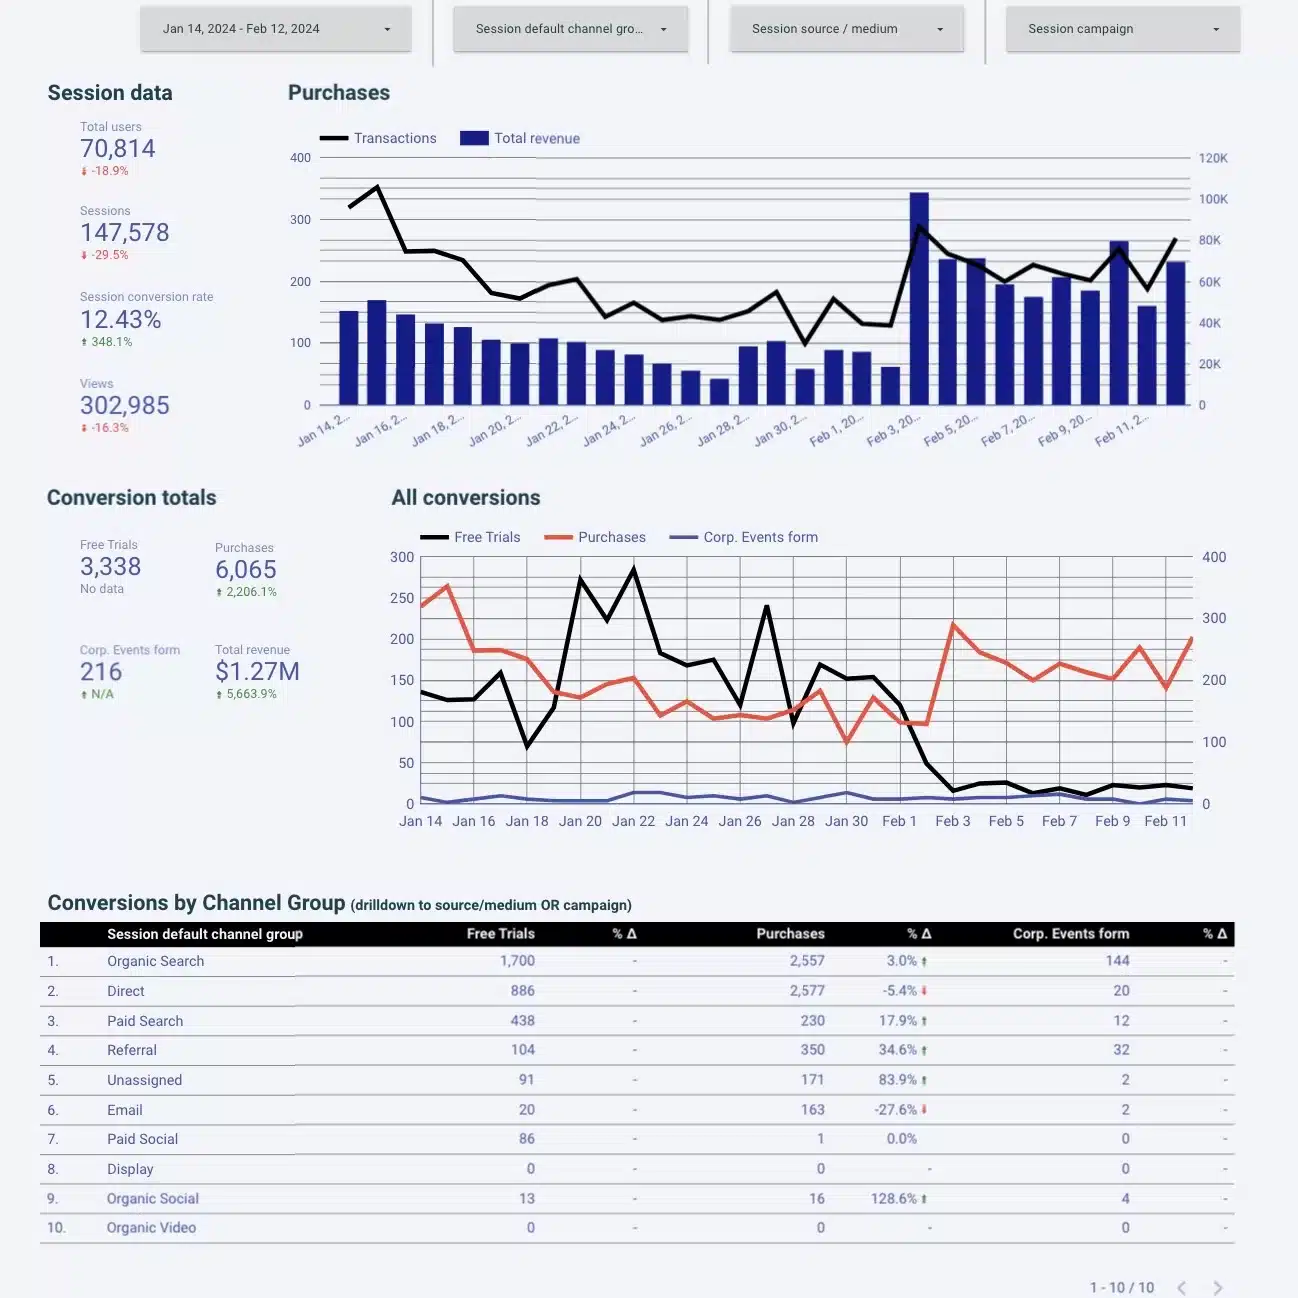
Google Looker Studio is a free reporting interface into which we pull data from all of the most popular marketing platforms into one singular dashboard. Here are just some of the platforms we source data from to build your analytics marketing dashboard.


These real-time dashboards incorporate a wide range of data visualization capabilities with customizable designs, styles, and formatting:
- Data filters
- Scorecards
- Simple tables
- Pivot tables
- Time series graphs
- Custom fields
- Bar charts
- Pie charts
- Scatterplots
- Geographic maps
Get your data together.
We build custom solutions to make reporting and analytics easier.
Functional reporting in a beautiful package
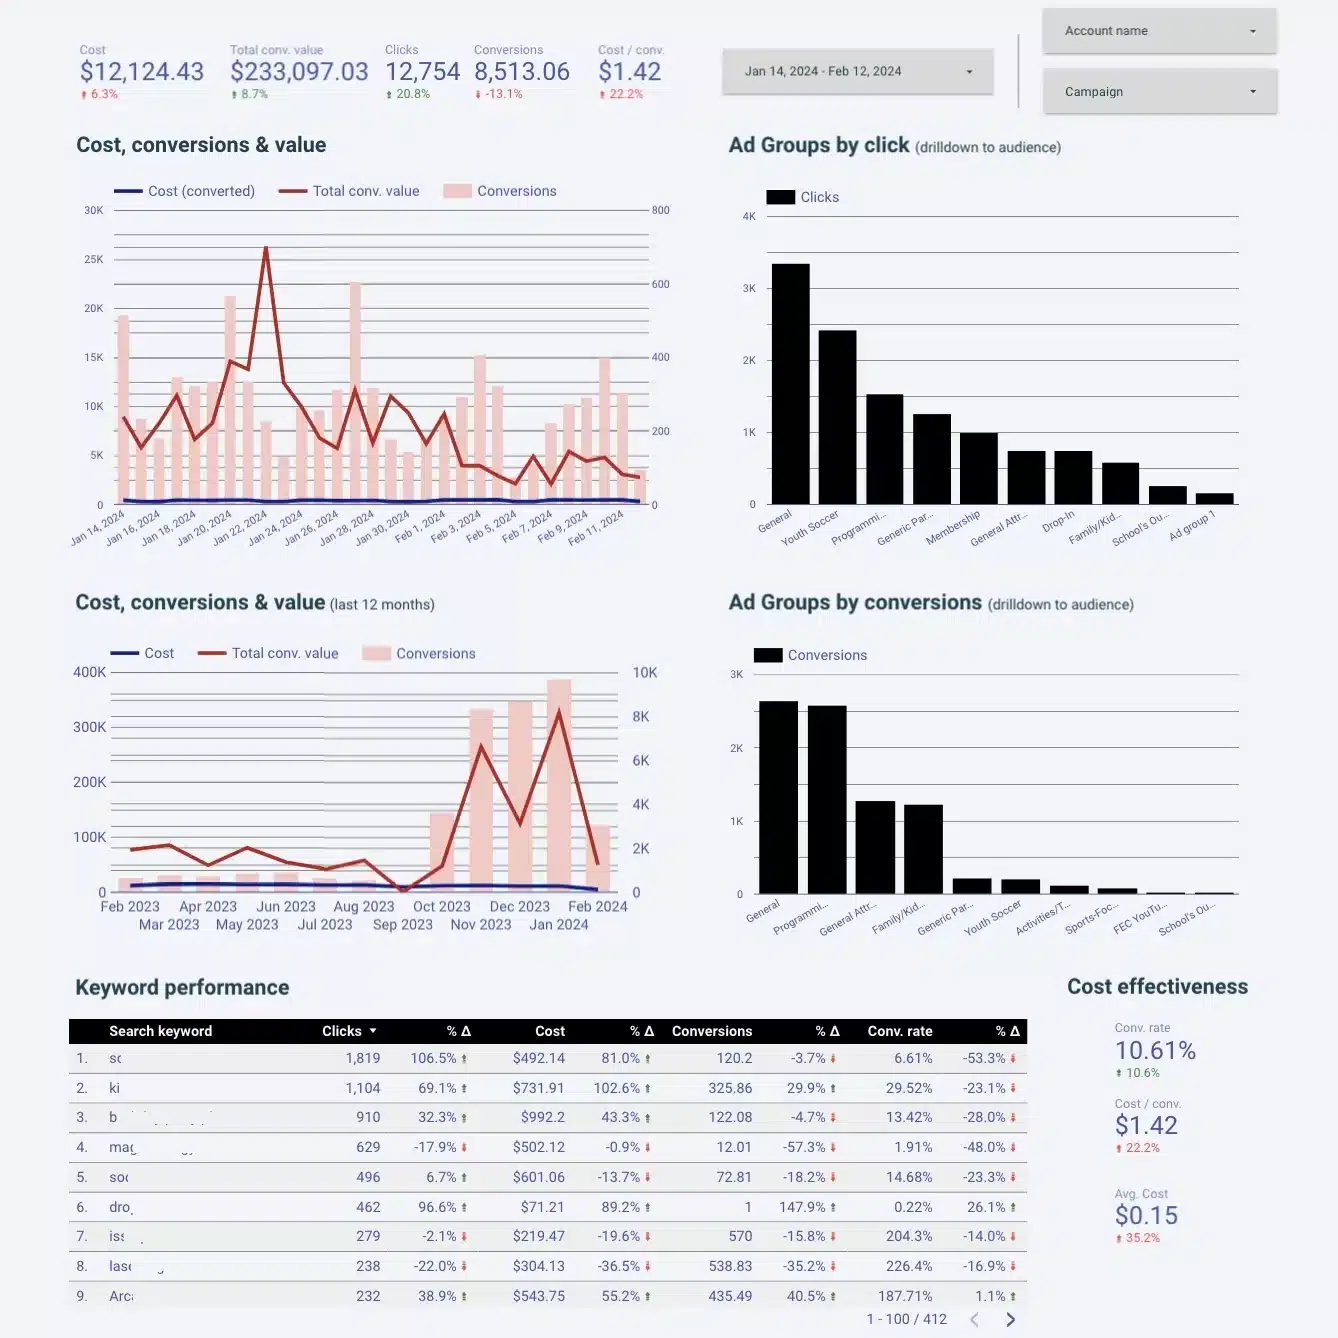
We build elegant reports with functionality in mind, giving our clients filters and controls in their reports to view data across different audiences, sub-sets of pages, date ranges, custom dimensions, and more. Whether you need an executive report for the high-level numbers, or a granular interactive report for the marketing team, we have you covered.
Streamline, simplify and speed up your reporting. Take the first step and talk to our team.
Complete the form to schedule a time to talk, or give us a call at 773-809-5002 and let’s chat for 15 minutes about your analytics goals.
"*" indicates required fields