
The importance of collecting field data for web vitals
Note: There is a known issue with Magento and this implementation which causes the web-vitals events to not fire.
Core Web Vitals is a set of best practices Google is pushing on the world to encourage webmasters to run quick websites. They began baking these metrics into their algorithm beginning in June 2021, so monitoring performance for these vital metrics is important for people who:
- Care about a snappy user experience
- Want Google to judge their website as a quality one
Checking your web vitals scores for one page is easy. Run a quick Lighthouse audit and Google will tell you your score. Real-time user monitoring of web vitals across your entire website over time is not so easy. Google Search Console will give you a high-level score, but there is no way to drill down to the page level.
In 2021, we shared a guide to capturing your Core Web Vitals and pushing the data into Universal Analytics. Google Analytics 4, however, is a whole new game. Because GA4 tracks everything as an event, it offers much more customization in tracking the things that matter most to your organization. It also means drastic changes in how event parameters work, so the standard category, action, value and label parameters from Universal Analytics will need a little adjustment to work in GA4.
In the past couple years, there has been a new vital metric on the scene: Interaction to Next Paint, or INP for short. While currently a “pending” metric, INP has been available through PageSpeed Insights and many other speed tests since May of 2022. Interaction to Next Paint will be fully replacing First Input Delay (FID) in March of 2024. If you’re hoping to track your web vitals in GA4, this might sound overwhelming, but luckily it just takes a few tweaks to get the data flowing.
Download and import our Core Web Vitals GTM recipe
We’ve created a recipe file that contains all of the GTM elements below, which you can download below.
- Download the GA4 CWV Recipe
Here’s a quick explainer on how to use it from Google, just be sure to merge the file rather than overwrite. From there, the only things you’ll need to do are:
- Edit the GA4 – web_vitals tag with your Measurement ID,
- preview and debug your container before publishing. We’ll go more into the debugging process below, and
- add your custom parameters in GA4.
Once that’s done, congrats! You’re now sending web vitals data to GA4. Keep reading for a more in-depth look at how these custom events are built and what you can do with them, or skip a little farther to read about how to analyze that data once it’s flowing.
Using Google Tag Manager to Push web_vitals Events to GA4
If you aren’t a GTM power user, the steps below might look daunting. Fear not, it’s easier than it seems.
To get your web vitals data flowing into Google Analytics, you’ll need to set up a few things in your Tag Manager Container:
- Custom HTML Tag that uses a script to push web_vitals events into the data layer. The script in the custom HTML tag is a modified version from Github created to manage Web Vitals APIs.
- Custom Event Trigger based on the event created from the tag above.
- Three data layer variables that match the values created by the custom HTML tag.
- Google Analytics 4 Event Tag using the created variables and trigger.
Step 1: Create Your Custom HTML Tag
Copy and paste the script below into a Custom HTML tag with the following steps:
- Tag > New Tag > Custom HTML
- Name the tag something like, cHTML – Web Vitals
- Copy and paste the script below
- Triggering > Select the All Pages page view trigger
<!-- Load 'web-vitals' using a classic script that sets the global 'webVitals' object. -->
<script src="https://unpkg.com/web-vitals@3.0.0/dist/web-vitals.umd.js"></script>
<script>
function sendToGTM(name, delta, id) {
  // Assumes the global `dataLayer` array exists, see:
  // https://developers.google.com/tag-manager/devguide
  dataLayer.push({
    event: 'web_vitals',
    cwv_metric: name.name,
    // Google Analytics metrics must be integers, so the value is rounded.
    // For CLS the value is first multiplied by 1000 for greater precision
    // (note: increase the multiplier for greater precision if needed).
    cwv_value: Math.round(name.name === 'CLS' ? name.delta * 1000 : name.delta),
    // The 'id' value will be unique to the current page load. When sending
    // multiple values from the same page (e.g. for CLS), Google Analytics can
    // compute a total by grouping on this ID (note: requires `eventLabel` to
    // be a dimension in your report).
    cwv_id: name.id,
  });
}
webVitals.getCLS(sendToGTM);
webVitals.getLCP(sendToGTM);
webVitals.getFCP(sendToGTM);
webVitals.getTTFB(sendToGTM);
webVitals.getINP(sendToGTM);
</script>
Please note, the script above references a filename, https://unpkg.com/web-vitals@2.1.0/dist/web-vitals.umd.js. Contributors to this project are releasing updates to this codebase, so check back to update your script with the latest version.
Enter your email in the field below to get added to our newsletter mailing list:
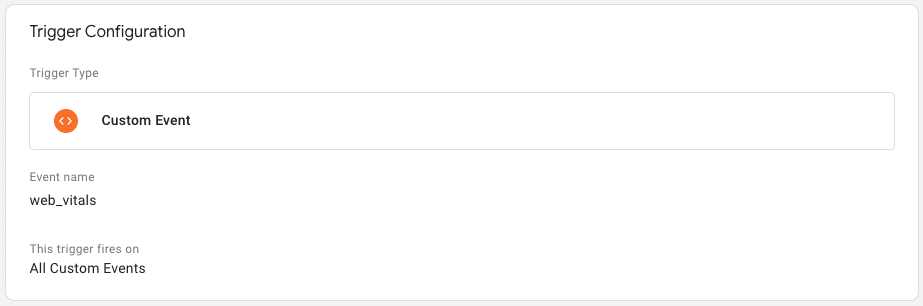
Step 2: Create a Custom Event Trigger
This step is easier than it sounds.
- Triggers > New Trigger > Custom Event
- Event Name: web_vitals
- Name the trigger Web Vitals
Step 3: Create the Data Layer Variables
These three data layer variables pull the corresponding value in the custom HTML tag created in step one. The values you need to create variables for are:
- cwv_metric
- cwv_id
- cwv_value
These variables collect the values from the data layer and store them so they can be sent to Google Analytics.
Create a variable for each value using the following settings:
- Variables > New > Configuration > select Data Layer Variable
- Name: DLV – cwv_metric
- Data Layer Variable Name: cwv_metric
- Data Layer Version: Version 2
- Repeat steps 1 – 4 for cwv_id and cwv_value

For reference, here are the values those variables will pull:
| Variable name | Value |
| cwv_metric | The name of the metric you are tracking, i.e. “LCP” or “CLS” |
| cwv_id | The unique event ID of each hit. |
| cwv_value | The actual performance number of the web vital, in seconds or milliseconds. |
Step 4: Create a GA4 Event Tag
You’re nearly to the finish line. All that’s left is creating our tag that will push events into GA4.
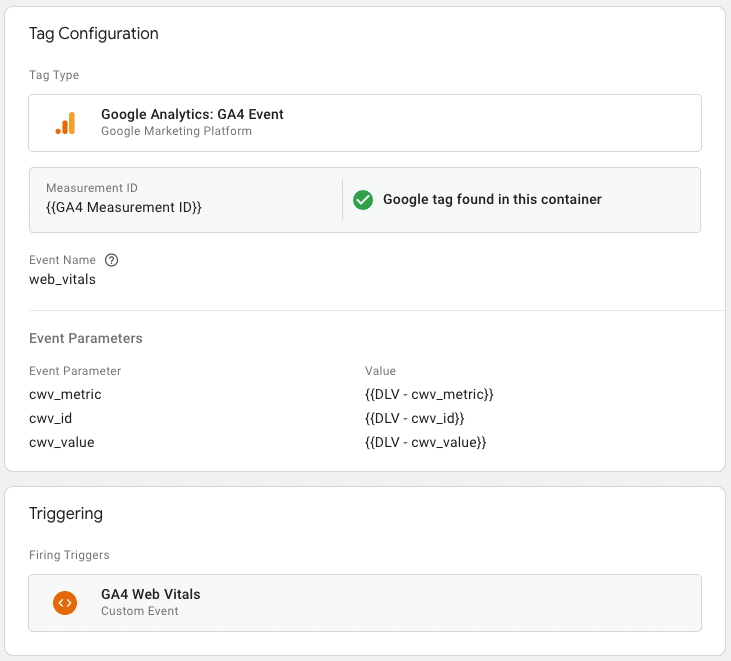
Creating a tag for a GA4 event in Google Tag Manager isn’t too different from creating a UA tag- the main difference is in how we configure our parameters. Here’s how to set up your Core Web Vitals GA4 event tag:
- Tag > New
- Name your tag “GA4 Event – web_vitals”
- From the pencil icon on the right side of the Tag Configuration section, select “Google Analytics: GA4 Event”
- Enter your GA4 property’s measurement ID in the Measurement ID field
- Event Name: web_vitals
- For the Event Settings Variable, you can leave it set to “None.”
- For Event Parameters, you’ll add names to the DLV variables you created earlier as follows:
| Parameter Name | Value |
| cwv_metric | {{DLV – cwv_metric}} |
| cwv_id | {{DLV – cwv_id}} |
| cwv_value | {{DLV – cwv_value}} |
- Firing Triggers: Select the Web Vitals trigger created earlier.
Step 5: Preview and Debug
Always preview your tags before publishing to make sure it’s working as expected. Enter preview mode in GTM. The tag should fire for each Web Vital event.
On each page load you should get up to five web_vitals events- TTFB, FCP, LCP, CLS, and INP- and if you select the data layer view for any web_vitals event, you should be able to see the values being pushed through, like so:
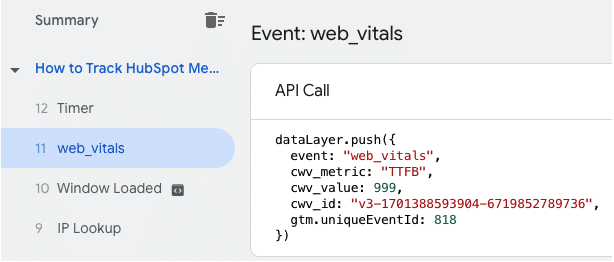
If everything is working correctly, you can publish the container. Congrats, your core web vitals data is now flowing into GA4, where you’ll soon be able to explore your site performance in depth. An important note, however: it can take up to 24 hours for custom events and parameters to show up in GA4, so you may have to check back in a day or two to follow the next steps.
Registering your new Core Web Vitals dimensions and metrics in GA4
GA4 offers far more customization than its predecessor, but it also requires more manual legwork when setting up custom event tracking of any kind. Whereas Universal Analytics came with a built-in event structure—category, action, label, and value parameters—we have to manually add our custom event parameters in GA4 as custom dimensions and/or metrics. Here’s how to do it:
Creating GA4 custom definitions
In your GA4 property, click the gear icon on the bottom of the left menu to navigate to Admin> Data Display > Custom definitions.
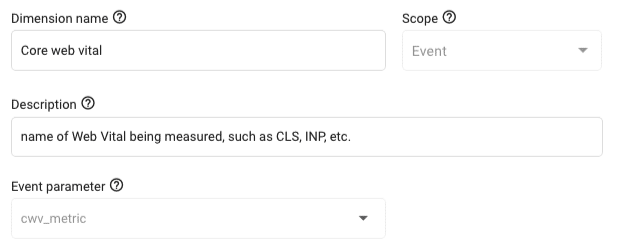
You’ll be creating two custom dimensions:
- “Core web vital” — dimension derived from the cwv_metric parameter
- “CWV ID” — dimension derived from the cwv_id parameter
And one custom metric:
- “CWV value” — metric derived from the cwv_value parameter
The process is pretty much the same for both. For the dimensions, start by selecting the “Create custom dimension” button at the top right of your screen. The Dimension name will be one of the two listed above (cwv_metric or cwv_id), the Scope will be Event, the Description is just a few words to help remind you what the parameter means, and the Event parameter will be the matching parameter we added in Tag Manager earlier. For example:
For your one custom metric, “CWV value,” follow the same process as above, but start from the “Custom metrics” tab of the Custom definitions menu. Also, make sure to set the unit of measurement to milliseconds — just remember that for solely the CLS values, it’ll actually be in seconds.
Once you have your custom dimensions and metric registered, you can confirm that GA4 is receiving your data by entering DebugView, a new feature in GA4. There are a few ways to look at traffic in DebugView; we think the easiest is through the GTM’s preview mode. As your debug events begin to appear, you can select any one to see more details on each event, including the data associated with our new custom parameters.

Creating a calculated metric for the average Core Web Vital value
There is an additional step needed in setting up GA4 to analyze this data well. To meaningfully analyze any of this data, especially at the page level, we want to be able to see the average Core Web Vitals score of any of these CWV metrics. To do this, we’ll need to create a Calculated Metric to pull the average values of our web vital metrics, rather than the default sum.
- In the Admin panel of your GA4 account under Data display, select Custom definitions > Calculated metrics > Create calculated metric.
- Name the metric “Avg. CWV value”. The API name will be autofilled for you based on the metric name.
- Add a description to help you remember what this metric is, like “calculated average cwv_value for Web Vitals events”
- In the Formula box, type {CWV value}/{Event count}
- As with our custom metric, you can select “milliseconds” as the unit of measurement, just remember that CLS is still in seconds.
- Click save, then you’re done!
How to analyze Core Web Vitals in GA4
Reports > Engagement > Events. However, we’ll have more flexibility with the parameters we created by using another new GA4 feature, Explorations. Here are the steps to create a quick visualization of your web vitals data.
Let’s build a custom Exploration report:
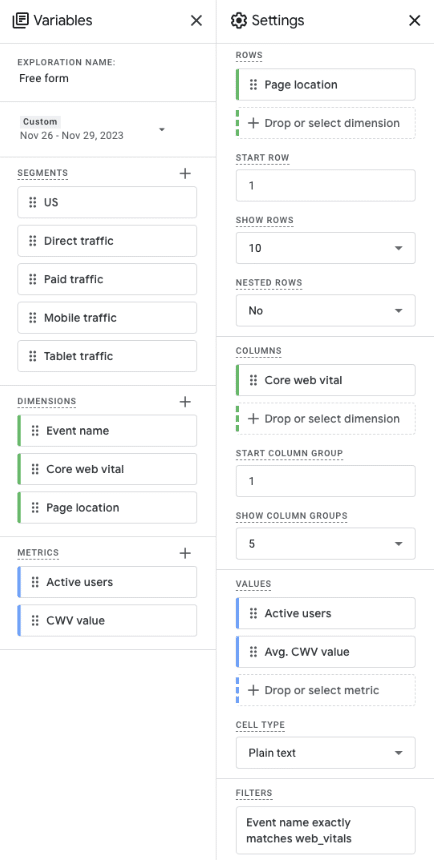
- Navigate to Explore and then create a new blank exploration.
- Click the + next to Dimensions in the left-side menu and import the following dimensions:
- Page location
- Event name
- Core web vital
- Next, import the following metrics:
- Active users
- Avg. CWV value
- In the right side of the left menu, add “Page location” as the row dimension, “Core web vital” as the column dimension, then “Active users” and “Avg. CWV value” as the metrics.
- Finally, add a filter to your report to include only web_vitals events. Under Filters, select the button that says “Drop or select dimension or metric” then select “Event name.” Select match type “exactly matches” and then enter “web_vitals” as the condition.
Your exploration’s settings should look like this:
In the actual report, you should see a table like the one below, showing your top pages and what their average values are for each Core Web Vital metric. You may have to sort by “Active Users” if you want to see your most visited pages at the top.
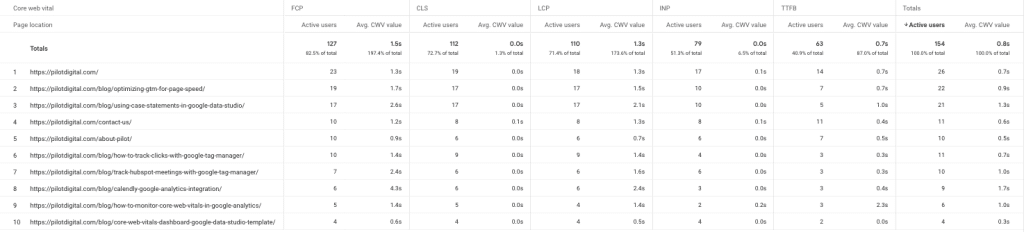
If you’d like to look at the data on a sitewide scale, you can create another tab with “Core web vital” as the row dimension and “Avg. CWV value” as the metric, with the same filter as before. This will show you the average value of each web vital over the date range you select:

Congratulations! You can now view your average LCP, TTFB, FCP, CLS, and INP at the page- and sitewide-level. With this data you will be able to analyze which pages need attention and monitor Core Web Vital performance going forward.