Snapshot
Twelve unique Google Data Studio dashboards allowed a university hospital network to monitor their new website’s performance on both a macro- and micro- level.
The challenge
An East Coast university hospital group was merging and redirecting more than 10 of their hospital websites onto their main domain. The client wanted to track the effects of this large scale website merger, and needed a reporting solution for the new website’s ongoing performance, in addition to Google Analytics audit and consulting.
The new website comprised the individual hospital domains as subdirectories — so localhospital.org became hospital.org/localhospital. While the client needed one domain-wide reporting solution for the new website’s performance, they also wanted dashboards specific to each hospital subdirectory to grant individual hospitals access to their own Analytics.
One issue resulting from the website merger was that their Google Analytics accounts were a mess — they wanted to keep each hospital’s Analytics account alive alongside the domain-wide GA account, but there were inconsistencies in how the accounts were set up, the goals that were tracked, and even how the tracking codes were being implemented on the website.
Our approach
Cleaning up their Analytics
First, we needed to clean up the Analytics accounts. We used Google Tag Manager and page path triggers to make sure the domain-wide Analytics code was on every page while the hospitals’ codes were only on their own subdirectory’s pages.
Using Google Tag Manager also allowed us to track new events—like a “Schedule An Appointment” button they recently added to doctor profile pages—by adding an event trigger in one place rather than having to configure each subdirectory’s Analytics account.
Baseline reports, updated with comparisons post-launch
To demonstrate clearly how the website merger affected traffic and user behavior, we created baseline reports for the 15 domains and subdomains then updated those numbers for the new website several months after launch.
Each baseline included the following data points:
- Users
- New Users
- Sessions
- Avg. Session Duration
- Sessions per User
- Pages per Session
- Pageviews
- Unique Pageviews
- Avg. Time on Page
- Bounce Rate
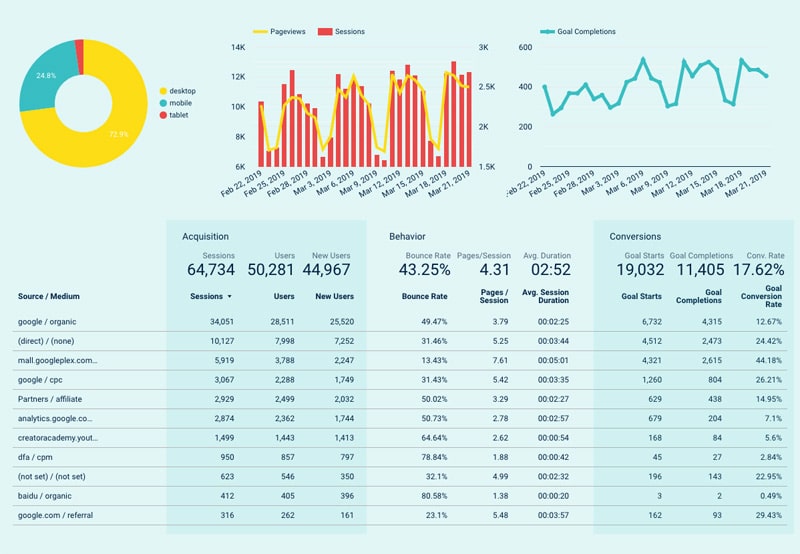
Google Data Studio dashboards for each hospital, and for the entire domain
The final aspect of the project was to provide a reporting solution to monitor their ongoing performance. This, too, needed to be divided into reports for the individual hospitals and for the entire domain.
We used Google Data Studio to create fully automated custom dashboards for each hospital subdirectory that would give them access to the data that interested them from multiple sources in real-time, without the need to upload new data.
The Data Studio reports presented the client the following data in a user friendly dashboard:
- Overview of Google Analytics KPIs
- Organic landing page & keyword performance from Google Search Console
- Tracking for scheduled appointments & mobile phone calls
- Conversion rates of Dr. Profile pages
- Google Ads campaign performance
- User interaction with their Event Calendar interface
Become our next case study.
Tell us about your project and we’ll come up with a solution that gets you results.